Tools Utilized: Tableau & R
Project Background
British Airways is the flag carrier airline of the United Kingdom. The airline is the second largest U.K.-based carrier, based on fleet size and passengers carried.
British Airways:
Has a fleet of 280+ aircraft
Carries 40 million+ customers a year
And serves those customers
35 million cups of tea
36.5 million meals
3.7 million bottles of wine
Project Scope
Problem Statement
As the airline industry strives to improve customer experiences, there is a major need to understand the key drivers of customer satisfaction in airline services, especially for a leading airline like British Airways.
Given the 2016-2023 dataset of British Airways reviews, what insights can be derived about the key drivers of customer satisfaction across different traveler types and seat classes? How can we predict future customer satisfaction trends?
Tableau Dashboard
*Ratings are on a scale of 10
Key Research Insights
The average rating in all aspects (cabin staff service, entertainment, food and beverages, ground service, seat comfort, and value for money) have greatly decreased since 2016. The average overall rating went from 6.1 in March 2016 to 2.3 in October 2023.
There appears to be no significant drivers of overall customer satisfaction.
There is a very weak positive correlation between entertainment, ground service, cabin staff service, and value for money, in relation to overall rating. This suggests that changes in these variables have little to no linear relationship with overall satisfaction.
There is a very weak negative correlation between food and beverages, and seat comfort, in relation to overall rating. This suggests that changes in these variables have little to no linear relationship with overall satisfaction.

Further segmenting customer satisfaction by seat class, traveler type, aircraft type, and continent revealed no significant correlations.
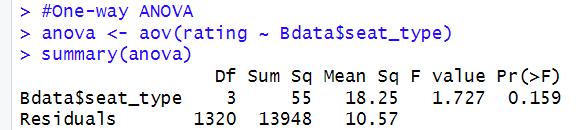
Seat Class
The p-value of 0.159 is greater than the significance level 0.05, hence we fail to reject the null hypothesis. There is no statistically significant difference in overall ratings between the different seat classes.
Traveler Type
The p-value of 0.393 > 0.05, hence we fail to reject the null hypothesis. There is no statistically significant difference in overall ratings between the different traveler types.

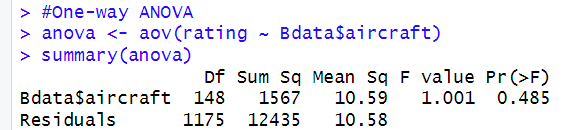
Aircraft Type
The p-value of 0.485 > 0.05, hence we fail to reject the null hypothesis. There is no statistically significant difference in overall ratings between the different aircraft types.
Countries
The p-value of 0.493 > 0.05, hence we fail to reject the null hypothesis. There is no statistically significant difference in overall ratings between the different countries that British Airways services.

Next Steps
To enhance overall customer satisfaction, British Airways should not focus on a single specific area but rather strive for improvements across all aspects of the customer experience. The analysis revealed that no individual factor significantly impacts the overall satisfaction rating, and there are no strong correlations between specific service components and the overall customer satisfaction. This suggests that customer perceptions of their experience are influenced by a combination of factors, and improvements need to be holistic rather than targeted.
In light of the decline in customer satisfaction since 2016, it is crucial for British Airways to investigate the underlying causes of this trend. Something to consider is that this decline might not necessarily be due to a deterioration in service quality but could be attributed to evolving consumer expectations. As consumer expectations continuously change, it is imperative for companies to stay attuned to these shifts to remain relevant and competitive in the market.
Suggestions:
Collect and analyze detailed customer feedback to understand specific pain points and areas of improvement, gaining deeper insights into customer sentiments.
Compare British Airways' service offerings and customer satisfaction levels with those of key competitors, identifying best practices and areas where competitors may be outperforming British Airways.
Regularly monitor changes in consumer expectations through surveys, focus groups, and market research to stay informed about industry trends and shifts in consumer behavior.
Implement robust quality assurance programs to maintain high standards across all service areas, regularly reviewing and updating quality assurance criteria to reflect current customer expectations.
Foster customer relationships through loyalty programs, personalized communications, and active social media presence, encouraging customer feedback and demonstrate responsiveness to their concerns and suggestions.
By taking a comprehensive and proactive approach to improving all aspects of the customer experience, British Airways can better meet the evolving expectations of its customers and enhance overall satisfaction. This holistic strategy will not all address current issues but also position the airline to adapt to future changes in the market and consumer preferences.